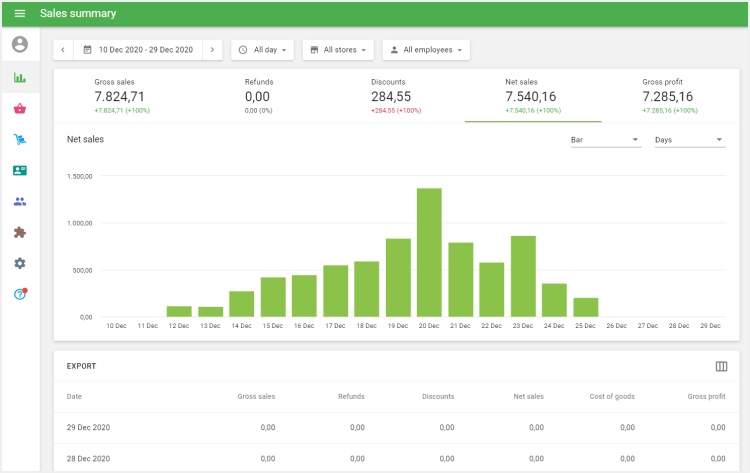
The Sales Summary report provides an overview of your store’s key sales metrics and helps you quickly evaluate business performance for a selected period.
When you open the Back Office, the Sales Summary section is displayed by default and shows the most important sales information at a glance.
1. Report Filters
At the top of the report, you can configure filters to refine your data:
- Period: Today, Yesterday, This week, This month, or a Custom date range
- Stores: Select one or multiple stores (if you manage several locations)
- Employees: Filter sales by one or multiple employees
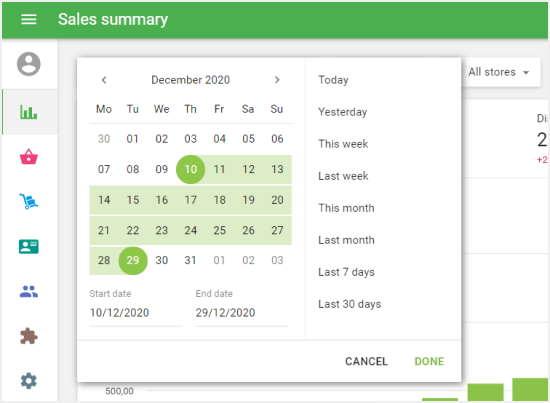
Note:
By default, access to sales data is limited to the last 31 days.
Start a free trial or subscribe to Unlimited Sales History to analyze sales for any time period.
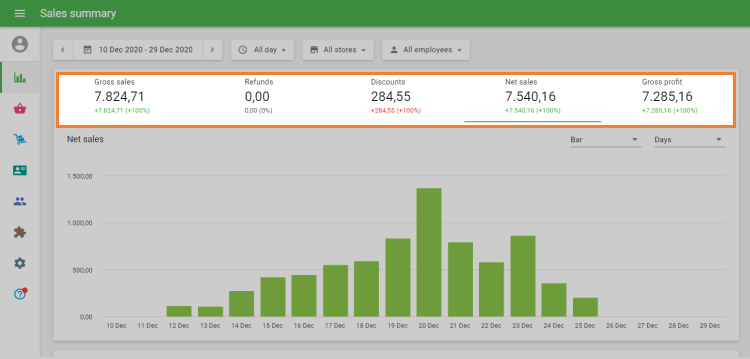
2. Key Sales Metrics
The Sales Summary includes tabs with the main sales indicators:
- Gross sales
- Refunds
- Discounts
- Net sales
- Gross profit
Below each value, you can see a comparison showing how much the result increased or decreased compared to the previous equivalent period.
Clicking on any metric opens a chart with detailed data for the selected period.
3. Definitions of Sales Metrics
Gross Sales
Gross sales represent the total revenue before discounts and refunds.
Calculation rules:
- Calculated as the sum of item prices before discounts, tips, and taxes
- If tax is included in the item price, it is included in Gross Sales
- Taxes added on top of the price are not included
- Modifier costs are included
- Discounts are not included
Refunds
Refunds represent the total value of returned items.
Calculation rules:
- Calculated as the sum of returned item prices before discounts, tips, and taxes
- If tax is included in the item price, it is included in the refund amount
Discounts
Discounts show the total value of all discounts applied.
Calculation:
Total discounts on sales receipts minus total discounts on refund receipts
Net Sales
Net sales reflect the actual revenue after reductions.
Formula:
Net Sales = Gross Sales − Discounts − Refunds
Gross Profit
Gross profit shows how much you earned after deducting the cost of goods sold.
Formula:
Gross Profit = Net Sales − Cost of Goods
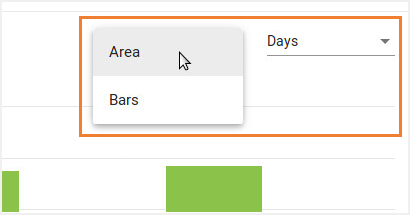
4. Sales Charts
In the chart view, you can customize how data is displayed:
- Chart type: Area or Bars
- Grouping: Hourly, Daily, Weekly, Monthly, Quarterly, or Yearly
This helps analyze sales trends over different time periods.
5. Sales Summary Table
At the bottom of the page, you’ll find a table with sales summary values broken down by day.
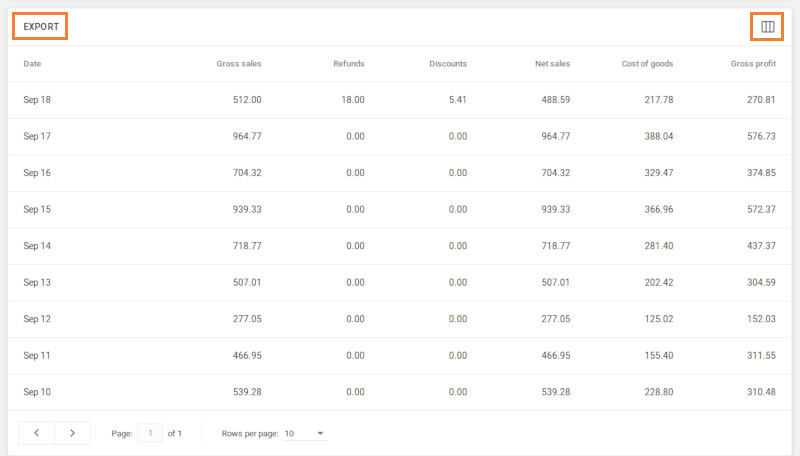
You can:
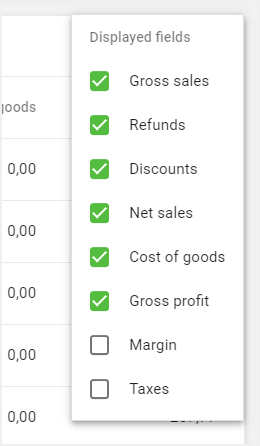
- Export the Sales Summary report by clicking the Export button
Note: Exporting sales reports is available with the Unlimited Sales History subscription. - Customize columns using the three-vertical-lines icon on the right side of the table header
See also: