The Sales by Category report helps you analyze how different product categories perform over a selected period. It allows you to compare revenue, costs, and profitability across categories, making it easier to identify top-performing and underperforming product groups.
Accessing the Report
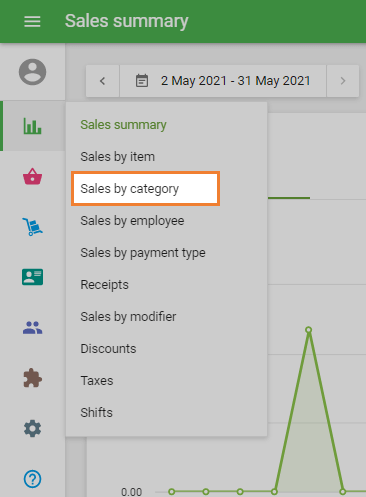
Log in to the Back Office and go to Reports → Sales by category.
Report Columns and Metrics
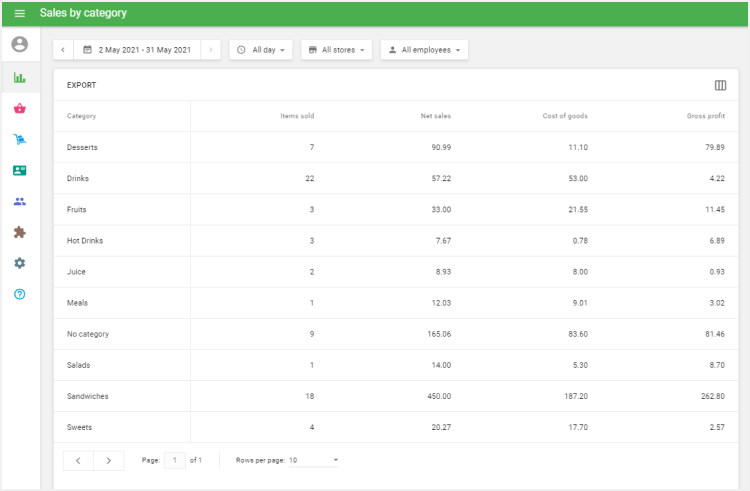
By default, the report displays the following columns:
- Category — List of item categories
- Items sold — Total number of items sold within each category
- Net sales — Revenue generated by the category after discounts and refunds
- Cost of goods — Total cost of sold items in the category
Gross profit — Net sales minus the cost of goods
Customizing Report Columns
You can add or remove columns to tailor the report:
Click the three-vertical-lines icon at the end of the table header.
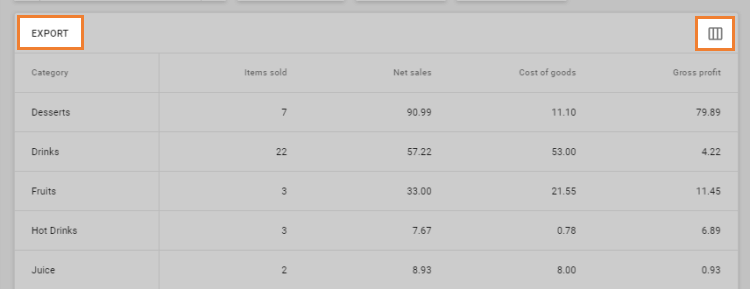
Select the columns you want to display.
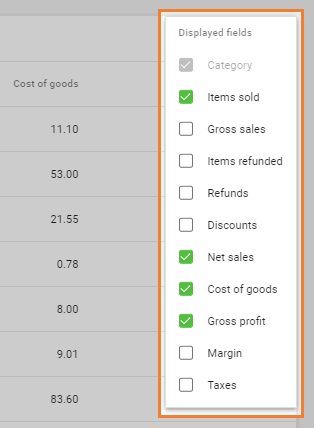
The report will update automatically.
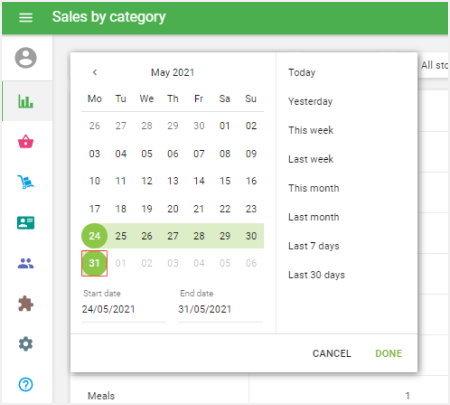
Selecting the Reporting Period
You can filter the report by time:
- Quick presets: Today, Yesterday, This week, This month
- Custom date range: Click the calendar icon, choose start and end dates, and click Done
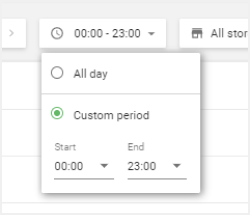
Custom Time Within a Day
If you need data for a specific time range during the day:
- Select Custom period instead of All day
- Set the start and end time
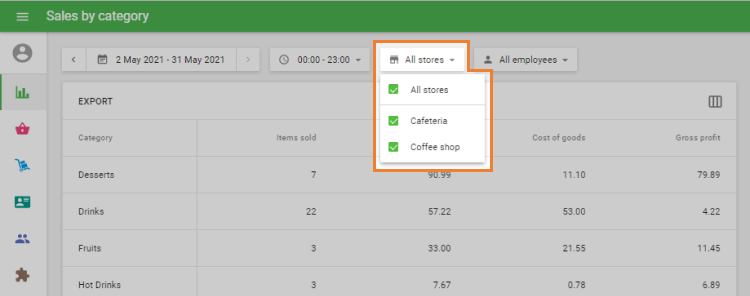
Filtering by Store
If you have multiple stores, you can:
- View data for all stores, or
- Select specific stores using the store filter
Free Version Limitation
Note:
In the free version, access to sales reports is limited to the last 31 days only.
Exporting sales reports is also unavailable in the free version.
To view sales data for any time period and export reports, start a free trial or subscribe to Unlimited Sales History.
See also: